Revisiting Equity Markets and Lifeboat Drills!

Preparation and planning are best done in advance of rough seas and that sinking feeling. How does that apply to your investments? Well, from time to time, stock markets pull back (decline, correct, crash…pick your headline) and it is during these times some clients become overly concerned about their wealth and its ability to get back on track. Others may worry about the sustainability of retirement income streams. Whatever the concern, Lifeboat Drills prepare us to weather the storms just as they do when out at sea and things get rough.
Take the 30% “peak to trough” decline of spring 2020 when COVID 19 first reared its head. Looking back, it seemed a short-lived concern – looking back! However, in March 2020, during the midst of the storm, some clients believed that their wealth was about to be destroyed and completely lost. Talk of a black swan event, economic hardship, food rations you name it, all led to worry albeit at different levels.
In reality, the outcome is almost always the same when one owns high quality, proven investments. Investments that match their time horizon, risk profile and other considerations. Broad based declines are followed by new market highs. Need proof – see the chart below. If you do view the chart, consider when it was best to invest money and
you will quickly conclude it was at the point of maximum consternation – the low point!
Today, I ask you to consider the “peak to trough” declines you see on the chart and recall the ones you lived through and prepare yourself for the next one. No – I don’t know when it will happen – no one does. What I can say is that after 13 years of a pretty strong upward trend, I would not be surprised if a pullback occurred. This in no way means it is imminent. The idea of owning equites is that you are rewarded for tolerating temporary stress/worry (declines) for the benefit of above average tax deferred returns over time. While nothing in life is guaranteed, history shows us this is what transpires over time.
While everyone knows good results can occur through investing in stocks over lesser periods of time, I have always maintained a 10-year time horizon is best, precisely because you don’t know when a pullback will occur. If you bought a collection of wonderful businesses (stocks) in 2000 or 2007, you would have seen a worrisome decline the next year and the recovery was measured in years, not months. However, if you had a ten-year time horizon, this became a non-issue for you. You had time to wait out recovery.
I prefer to place investments in “silos”. One silo for short term needs/emergencies and income; 1–5-year money needs. A second silo that perhaps owns real estate, private investments and other income-oriented investments; 5–10-year money.
The final silo designed to hold common stock that is providing above average inflation fighting returns over time; 10 plus years. It is this last silo that provides the returns everyone wants/brags about, but it is punctuated with declines – sometimes sharp ones during events like COVID 19, the Global Financial Crisis and others. Clients are paid handsomely for tolerating these pullbacks because after each one is a new high and over time the growth is usually impressive. Again, review the charts below. This last silo also defers and reduces taxation in non-registered accounts, has a history of crushing inflation and protecting your purchasing power down the road.
Life Boat Drills involve looking back on the charts provided here and revisiting the “peak to trough” declines. Could you handle one or all of those when they next happen? Maybe you can tolerate a 25% decline but not a repeat of the 2008/2009 Financial Crisis which was 50%? Portfolios are designed to provide a mix of results. You cannot have great long term above average returns, tax deferral and linear results. It does not work that way. What does work is mixing the right constituents (fixed and income-oriented investments) to provide balance and stability to the degree that should satisfy the desired risk profile.
No one knows when the next pullback will occur. What is important is one will occur at some point. What’s more important is how you react when the next one takes place. Now is the time to convey any specific need (new roof, new car, new vacation property – you get the idea) over the coming months and next few years. By communicating withdrawal needs we can plan now and rebalance the account to favour the first silo and cover off these expenditures regardless of a market pullback. The downside is perhaps a bit of tax now due to capital gains on recent growth, and the potential loss of growth due to exiting great businesses. This is the tradeoff.
Each client has an internal tolerance for risk and specifically “statement shock” represented by a peak to trough decline. These are linked to tax needs, time horizon (silo constituents), income needs, planned expenditures and of course, one’s worry rates. The fact is that broad based declines are temporary – you just need to sit them out! Sometimes this takes a few months and sometimes this takes a few years. While enduring a market decline in the future, revisit the two charts that follow and remember that this has been historically the best time to invest. When evaluating the two charts below, it’s important to distinguish the meaning behind each over the past 23 years.
The first chart titled “Market Performance” showcases the price movement history of the two broad market indices; USA S&P500 (Blue), Canada’s TSX (Green), alongside two stocks; Royal Bank Common Stock (Purple), and Berkshire Hathaway Class B Shares (Orange) since 1998. This includes all the ups and downs (peak to trough) periods of turmoil, but it also showcases the upwards trend of financial markets. Notice the beginning value (left)and end value (right).
Market Performance of TSX/S&P500 (1998-2021)
This second chart titled “Total Return” provides a picture beyond the daily movements of stock prices and showcases what would have transpired had you invested in the same two indexes and two stocks and simply gone about your life and ignored them since Your patience would have been massively rewarded. While the daily price movements of equities and the chart depicting peak to trough declines may look intimidating, it’s important to remember to contextualize it within a total return chart that includes reinvested dividends which add to the returns and reduce any one-year loss. As such, this illustrates the importance of understanding that investing is a longer-term proposition best housed in the 10 plus year silo. It also illustrates that despite the temporary pullbacks in the market, the advances are permanent for those who have patience and do not panic/sell in a declining market. Looking back, when would have been the best times to invest more money? During the low points of course…the point of highest pessimism, fear
and despair. Doing so would have made for very handsome returns. Again, note the trend is up and also notice what became of the original $10,000 investment made in January 1998. Despite all the talk of Tech Wreck, Global Financial Crisis, COVID 19 and everything else worrying investors in-between – the payoff was very good! Want a bonus? No tax would have been paid on any realized gains until they were sold, and then only a portion would have been taxable. Nice!
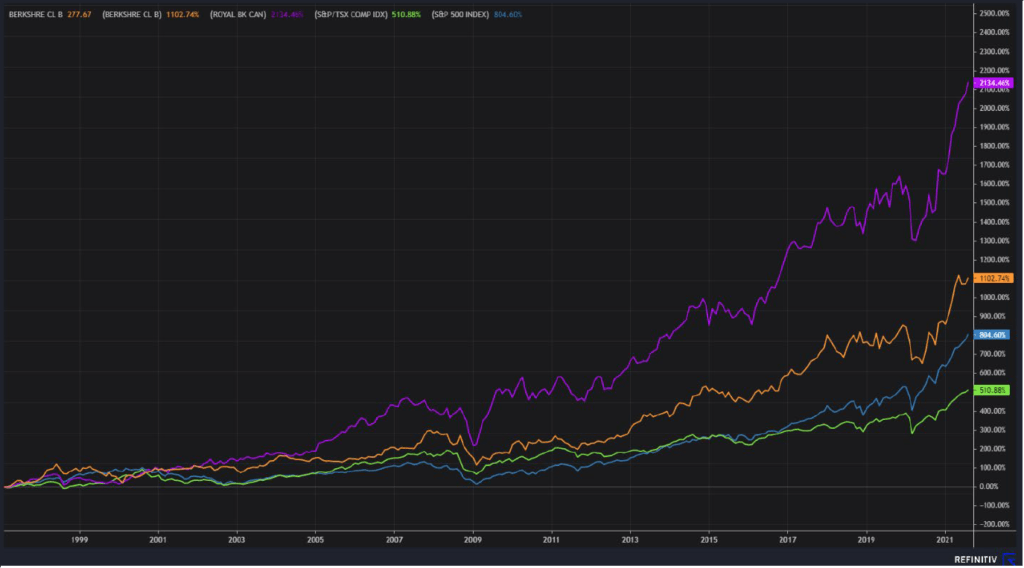
Orange: Berkshire Hathaway Class B Common Shares
Purple: Royal bank of Canada Common Shares
Green: TSX Composite (Canada’s Top 300 Companies)
Blue: S&P 500 (Top 500 USA Companies)
Written by Michael Prittie, Portfolio Manager